Design of Monitoring System for Power Quality Parameters of Electrified Railway
0 Preface
Electrical energy is the most widely used energy in modern society, and its application degree is one of the important indicators to measure the development level of a country. In recent years, with the rapid development of China's power industry, the scale of the power system has been expanding. At the same time, users are increasingly demanding power quality, making the issue of power quality increasingly pressing in front of people. The quality of power quality is directly related to the overall benefit of the national economy. As an important infrastructure of the national economy, railways play an important role in China's comprehensive transportation system. In accelerating the construction of a conservation-minded society, the railway shoulders important responsibilities. On the one hand, as a key energy-consuming industry, there is great potential for digging in energy saving and consumption reduction and improving the overall energy application efficiency; on the other hand, electrified railways have long-term problems such as low power factor, high harmonic content and negative sequence Affect the power quality of the public power grid. Judging from the history and trend of railway development in China, the proportion of electrified railways in the road network will become larger and larger, and the impact on public power grids will also become more and more serious. Therefore, establishing and implementing power quality monitoring and analysis is an important technical means to improve power quality. The development of a new type of power quality parameter monitoring system to effectively monitor power quality parameters is of great significance to ensure the safety, economy and reliability of power system operation.
Currently. Portable power quality monitors are still used for power quality measurement in most areas of the country. Due to the single measurement index of the instrument, it cannot be continuously monitored, and the measurement labor intensity is large, so it cannot well meet the needs of power quality management. With the rapid development of digital measurement technology, computer technology and network communication technology, some domestic research institutes have launched research on remote monitoring systems for power quality. Using computer remote online monitoring, continuous multi-point monitoring, and auxiliary management, so it can overcome the defects of traditional manual monitoring methods. The application of virtual instrument technology to the power quality monitoring system in this paper also has the above-mentioned advantages and is more convenient to implement.
1 Overall system structure
The electric railway power quality parameter monitoring system based on virtual instruments must also have three major functional modules of the traditional monitoring system, namely the data acquisition module, data analysis processing module and result display module. The data acquisition module is still completed by traditional acquisition hardware. The difference is that the data analysis and processing module is completely implemented by computer software. This part of the function is not limited by hardware. You can add and modify modules at any time according to user needs. This advantage is Unmatched by traditional instruments. The software part of the power quality parameter monitoring system studied in this paper is the core. As long as the hardware part converts the voltage and current signals of the monitoring point to the digital signal with the minimum distortion through the signal conditioner and data acquisition card, the remaining tasks (such as adding Windows, filtering, data processing and statistical analysis, data remote transmission, display printing, etc.) are completely left to the software to handle.
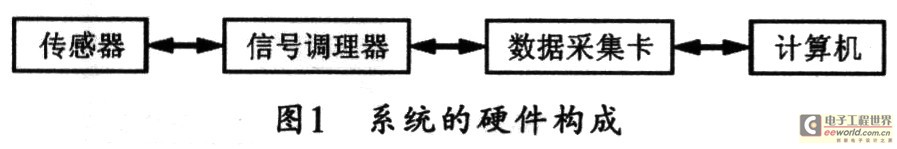
The hardware of this system is composed of sensors, signal conditioning modules, data acquisition cards and computers. Its hardware structure is shown in Figure 1.
The software development environment of this system is LabVIEW, which is a virtual instrument software development tool based on G language introduced by American NI company. For a virtual instrument system, software is the key and soul, and hardware is only used to solve the signal input and output.
2 Overall system design ideas
The functions to be realized by the electric railway power quality parameter monitoring system based on virtual instrument technology include the realization of different parameters such as the effective value of voltage and current, voltage deviation, grid frequency, frequency deviation, three-phase unbalance, harmonic content rate and flicker. At the same time. Therefore, this design uses a modular approach, each functional module completes the corresponding function, and finally completes the system design through integration. The biggest advantage of using a modular structure is high efficiency. Since modules can share data and can call each other, it is possible to achieve very high overall efficiency by flexibly organizing modules. If you need to upgrade a certain function of the module, you only need to rewrite the corresponding module without changing the entire software structure. When the system function needs to be increased, only the corresponding software function module needs to be added.
The modules of power quality measurement mainly include data acquisition module, effective value measurement module, voltage deviation measurement module, frequency measurement module, frequency deviation measurement module, three-phase unbalance measurement module, power measurement module, harmonic measurement module and flicker measurement Modules etc. Among them, the effective value measurement module, voltage deviation measurement module, frequency measurement and frequency deviation measurement and three-phase unbalance measurement module can be integrated into one module, namely the volt-ampere measurement module, and its system function is shown in FIG. 2.
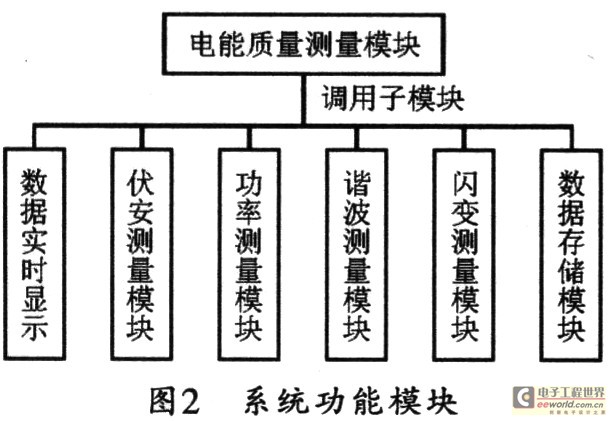
The entire system of power quality monitoring can be divided into five large modules, such as acquisition and real-time display, volt-ampere measurement, power measurement, flicker measurement, and harmonic measurement. It can be constructed by calling different small function modules.
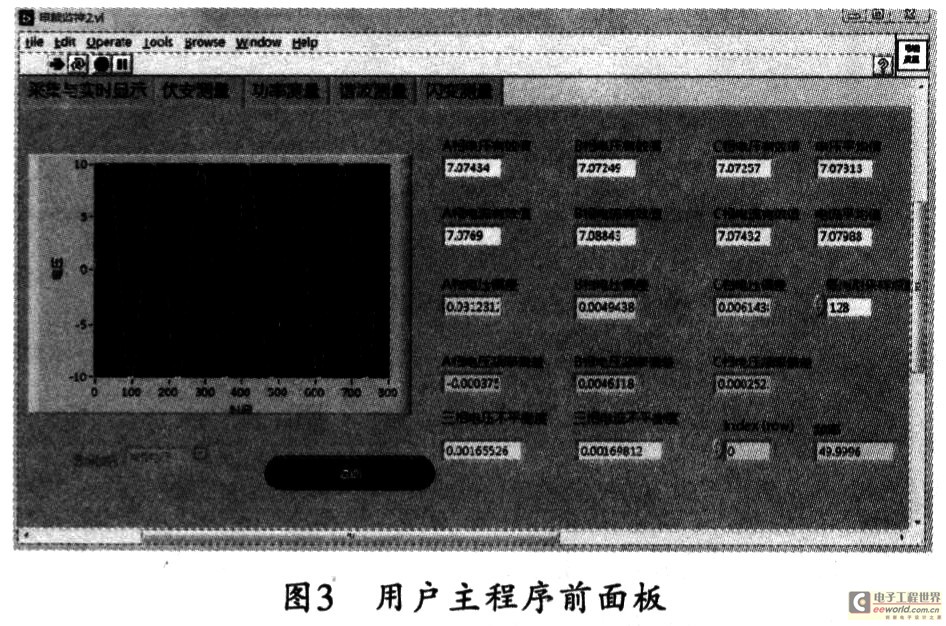
In the front panel of the main program, you can use the tab control "Tab Control.vi" function function provided by LabVIEW to implement paging. The program page in the figure shows the voltammetry page, and each page can realize different test tasks.
3 Power parameter measurement procedures and test results
For electrified railways, the power quality evaluation indicators of the power supply department mainly include power factor, three-phase voltage imbalance, each harmonic voltage and harmonic current, voltage total harmonic distortion rate and voltage fluctuation and flicker. The power parameters monitored by this system include current, voltage, frequency, harmonics, power factor, power (right power, reactive power, apparent power and total power), three-phase voltage unbalance, three-phase current unbalance and Wait.
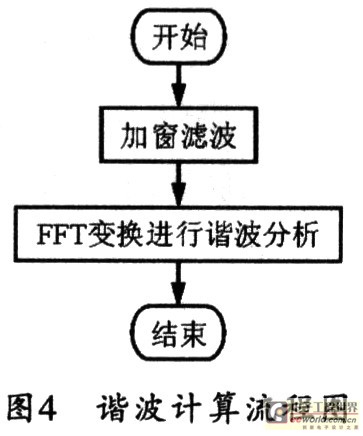
Due to spectral leakage, in order to reduce leakage errors and avoid aliasing of the signal during harmonic analysis, the signal must be windowed first, and then the harmonic analysis is completed by FFT transform. Taking the harmonic measurement of the A-phase voltage as an example here, a flowchart of harmonic calculation based on LabVIEW as shown in FIG. 4 is given.
The harmonic measurement module generally needs to measure the three parameters of each harmonic frequency, amplitude and THD. There are many methods of harmonic analysis. The theory and implementation are relatively mature is the fast Fourier transform (FFT) analysis method. LabVIEW provides a harmonic analysis software package for direct spectrum analysis.
According to the third article of Appendix D in GB / T14549-93: For harmonic sources with rapid load changes (such as steel-making electric arc furnaces, electric locomotives, etc.), the measurement interval is not more than 2 min, and the number of harmonic measurements Not less than 30 times. According to IEC 1000-4-7: 1991, Electromagnetic Compatibility (EMC) Part IV, Section 7, the harmonic measurement range is taken from the fundamental wave and the 2nd to 40th harmonics. In this system, the total harmonic order is 40 times.
When you need to perform harmonic analysis on the collected data, you can use the index array Index Array to take out each line of data from the data file "collection database, dat", and load the input signal in the function function "Hamming Window.vi" On the pin, set the harmonic order through #harmonics (the harmonic order can be set to 40 times 1, so that the amplitude and frequency of each harmonic will be represented in an array. Since the amplitude and frequency of harmonics include The fundamental frequency component, so you can use "Delete From Array.vi" to remove the fundamental signal, and then use the harmonic amplitude graph to display the amplitude of each harmonic except the fundamental wave. Figure 5 shows the A-phase voltage harmonic Flow measurement flow diagram.
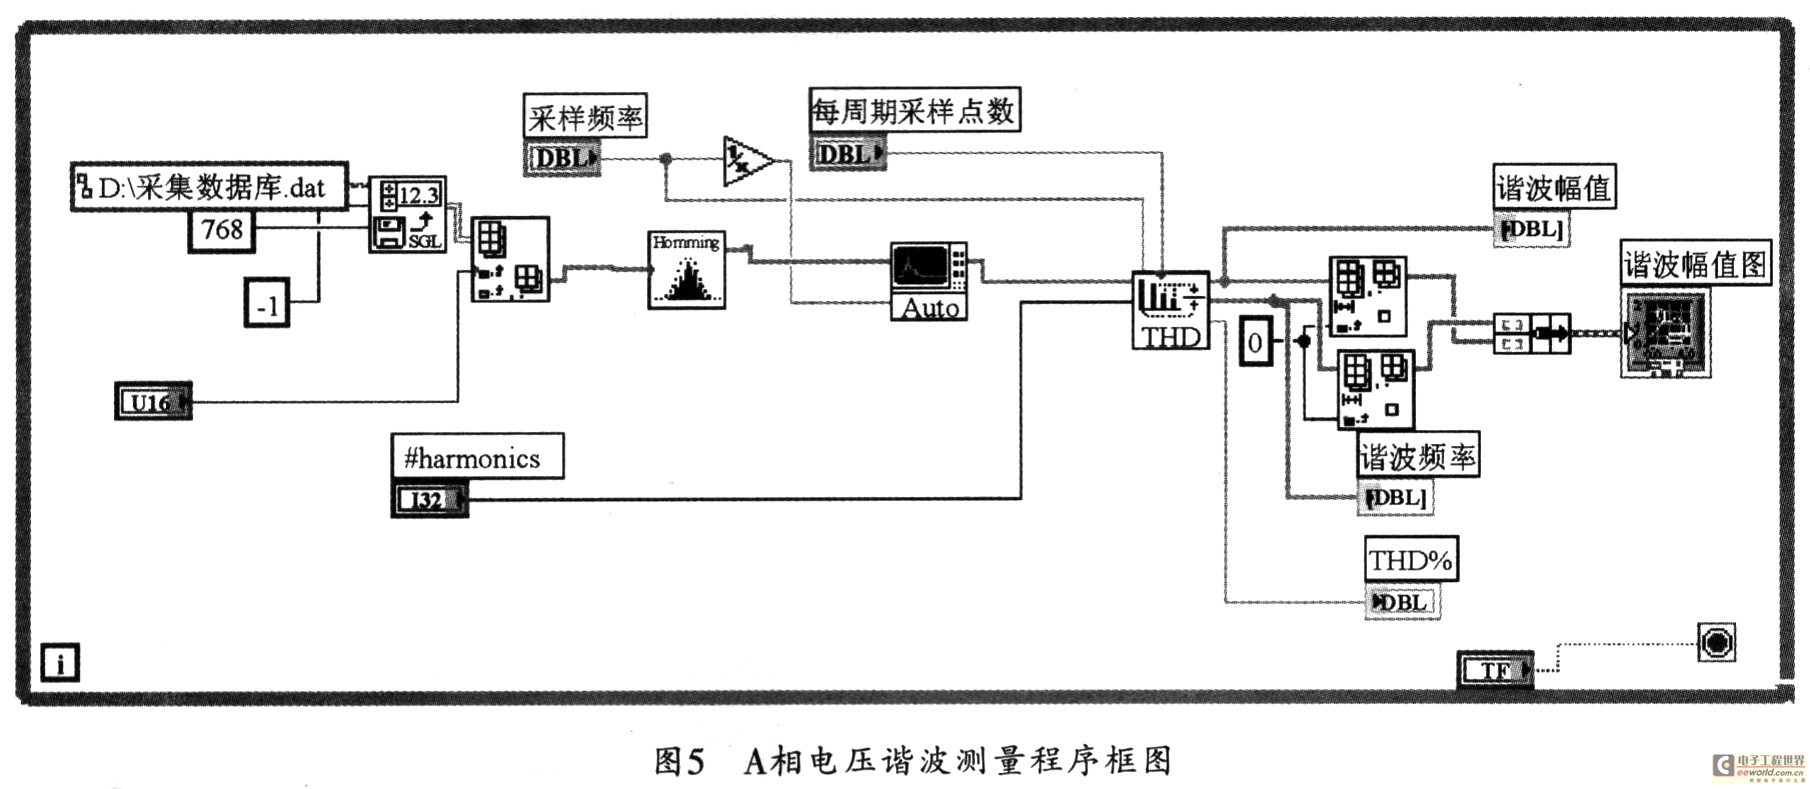
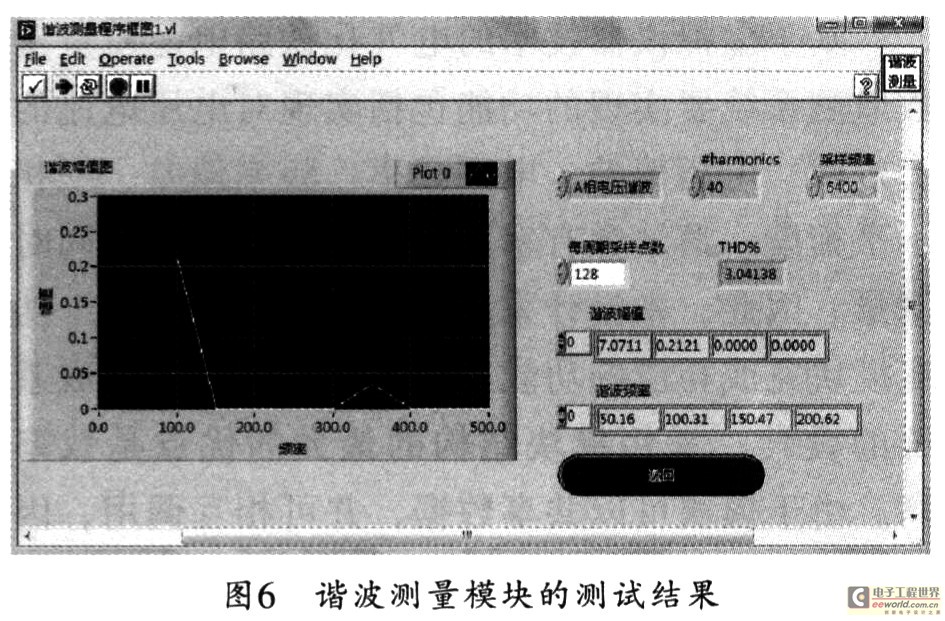
Fig. 6 shows the display panel diagram of A-phase voltage harmonic measurement. Fig. 6 shows the harmonic frequency, harmonic amplitude and THD%, which can be displayed by array control and numerical control respectively, and the amplitude of each harmonic except for the fundamental wave is displayed by graphical control.
4 Conclusion
The use of virtual instrument technology in power quality monitoring has the advantages of simple hardware structure, short software development cycle, and flexible function expansion. Judging from the simulation results, the system runs well and has stable performance. The calculation results, design ideas, and actual conditions are in line with each other, and can meet the requirements for power quality parameter monitoring.
New type AC Contactor, our model is BC1-D series. New AC Contactor is the new designed AC Contactors, which with a new face appear to the user with high quality product. This product uses the fresh PA66 nylon material, no any recycled material mixed. Have high protection level for the fire-resistant. White body, yellow inserting core, looks more charming. All the metallic parts are standards of quality control.
The AC Contactor is suitable for using in the circuits up to the rated voltage 660VAC 50Hz or 60Hz, rated current up to 95A, for making and breaking and frequently start, controlling the AC motor. Combined with the auxiliary contactor group, air delayer, machine interlocking devices etc. It is combined into the delay contactor, mechanical interlocking contactor, star-delta starter, with the Thermal Relay, it is combined into the electromagnetic starter.

New AC Contactor
AC Contactor,Magnetic AC Contactor,ACMagnetic Electric Contactor,Electrical Power AC Contactor
Ningbo Bond Industrial Electric Co., Ltd. , https://www.bondelectro.com