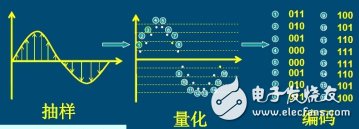
When using electronic measuring instruments, waveform viewing is the most commonly used function. How is waveform acquisition and reconstruction generally implemented? The two typical instruments in the acquisition method are the oscilloscope and the power analyzer. Today, Xiaobian will briefly introduce the common waveform acquisition methods for transient and steady-state measuring instruments.
According to the Nyquist sampling theorem, the reconstructed waveform sampling frequency that can be completed should be at least 2 times the highest frequency of the signal, and when the maximum sampling rate of the oscilloscope exceeds the frequency of the measured signal by 2 times, the oscilloscope acquires in a “scanâ€. Far enough samples to build accurate images, this is the common acquisition method for digital oscilloscopes - real-time sampling. Real-time sampling is the only way to capture fast signals, single-shot signals, and transient signals using an oscilloscope.
When the sampling process does not satisfy the Nyquist sampling theorem, consider using another acquisition method, equivalent sampling. The basic principle of equivalent sampling is to convert high frequency and fast signals into low frequency and slow repetitive signals for acquisition. In order to achieve the purpose of low-speed sampling to restore high-frequency signals, it is required that the measured signals must be periodically changed. If each sampling point is arranged in a different signal period and taken from a different waveform, rather than in the same period, The sampling frequency can be greatly reduced. Finally, the sampling points in multiple cycles are restored to one cycle by mathematical methods, and the measured signal is reconstructed.
Such equivalent sampling can use a sampling frequency that is less than twice the frequency of the original signal without distortion and restore the original signal, suitable for sampling and analyzing the high frequency periodic signal. For example, when measuring high frequency signals, if the sampling rate is not enough, you cannot collect enough samples in one scan. Equivalent time sampling can be used to accurately acquire signals with frequencies above the acquisition rate of /2.5. Equivalent time sampling builds an image of a repetitive signal by capturing a small amount of information from each iteration. The waveform is slowly constructed, like a string of lights, lit one after the other. The oscilloscope accurately captures signals with frequency components much higher than the oscilloscope's sample rate.
Equivalent sampling can be divided into sequential equivalent sampling and random equivalent sampling.
The sequential equivalent sampling is to capture a sample at intervals of K cycles, and a sample is obtained after a slight delay Δt every k cycles. Assuming k = 1, the equivalent sampling and reconstruction process of N points is sampled per cycle. Finally, the collected data is pieced together into one cycle to realize the reconstruction of the original input signal waveform. The reconstructed sampling frequency becomes the reciprocal of the small delay Δt. By controlling the magnitude of this Δt, the frequency of the equivalent sampling can be controlled. The actual sampling frequency can be adjusted by controlling the size of K. The larger K is, the smaller the actual sampling frequency is; the smaller the Δt is, the higher the equivalent sampling frequency is. This achieves the purpose of sampling high frequency signals at low speed.

Figure 1 sequential equivalent sampling
Random equivalent sampling uses an internal clock that is out of sync with the input signal and the clock triggered by the signal. Samples are continuously acquired and independent of the trigger position. The waveform is reconstructed by recording the time difference between the sampled data and the trigger position to determine the position of the sample point in the signal. This creates the problem of accurately measuring the position associated with the sampling trigger point. Although the samples are continuous in time, they are random relative to the flip-flop, resulting in a "random" equivalent time sampling.
Unlike an oscilloscope, an instrument that analyzes steady-state signals, such as a power analyzer, can perform sampling operations using the concept of equivalent sampling. It is required that the signal to be measured must be a stable periodic signal, otherwise the measurement result will have a relatively large error. Therefore, the power analyzer is a steady-state measuring instrument with weak transient analysis capability.
When the instrument uses a fixed sampling rate for sampling, there may be cases where the sampling point is fixed at a fixed position of the signal to be measured. Therefore, it is considered to introduce random sampling, that is, to dynamically modify the sampling rate, so that the measured signal and the sampling rate can be guaranteed. There is no integer multiple relationship between each other, which can well avoid the result that the sampling point appears at a fixed position of the measured signal, which makes it impossible to accurately measure.
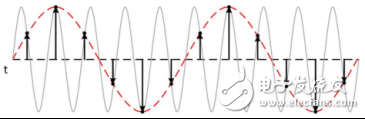
When the sampling rate of the instrument is lower than the input signal frequency, the high frequency components contained in the signal will be lost. At this time, according to Nyquist's sampling theorem, the phenomenon that high-frequency components in the instrument signal are misprocessed into low-frequency data occurs, which is called aliasing. Random sampling is to solve the aliasing problem.
Implementation principle: by increasing the sampling rate, and then randomly extracting the method, and finally become the sampling rate of the equivalent instrument. This is equivalent to moving samples.

Figure 2 Frequency aliasing
When the measured signal frequency and the sampling rate are in an integer multiple relationship, the sampling rate is fixed at a fixed position of the measured signal for the entire update period, and the amount of information obtained by sampling to obtain the measured signal is very A limited part of it is unable to obtain all the information of the signal under test, and the result will be inaccurate measurement and jitter. When there is no integer multiple relationship between the sampling rate and the measured signal, the sampling point will accumulate on the entire waveform of the measured signal according to the time of each period, and then all the valid information of the measured signal can be obtained, thereby Calculate the accurate measurement results of the measured signal.
For example, when the input signal frequency is higher than 100 kHz, a sampling point of 5 microseconds (200 kHz) is not enough to describe an input signal period. However, the envelope formed by multiple periodic sampling points is consistent with the amplitude of the input signal, and the frequency is lowered. The measured effective value is consistent with the actual effective value, so signals higher than fs/2 can be measured. This aliasing process can be simply understood as "frequency conversion". However, it is necessary to avoid the case where the signal frequency is an integer multiple of fs/2, fin=n*(fin/2), n=1, 2, 3.... These frequencies are 100 kHz, 200 kHz, 300 kHz ... at 200 kHz, and near these frequencies, random sampling extraction is required.
In addition, the power analyzer cannot fully reflect the details because the display pixels are much smaller than the number of sampling points in one update cycle. When the power analyzer displays the waveform, it provides two extraction methods: equal interval extraction and peak extraction;
The equal interval extraction is the sampling point 2M, the display point number is 2k, and the actual display is 1k points to extract one, that is, the first point, the 1001th point, the 2001 point, and the like are displayed.
The peak extraction is 2M for the sampling point, 2k for the display point, the actual display is 2k points to extract two, the maximum and minimum values ​​are found between 0~2000 points, then the maximum and minimum values ​​are found between 2001~4000, and so on. , reconstruct the waveform. As shown below:
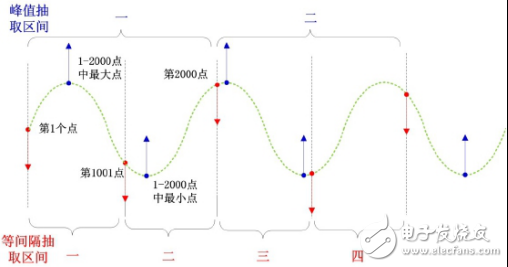
Figure 3 Power analyzer two extraction methods
In summary, it can be seen that an oscilloscope that measures signal transients tends to depict more "dense" points in waveform reconstruction, showing stronger transient capability; as opposed to an oscilloscope, as a steady-state measured power The analyzer has no dead zone, mainly focusing on rms measurement. The waveform extraction focuses on the characteristics and amplitude of the signal. This method is more suitable for steady-state applications. In addition, nowadays technology advancement, ZLG Zhiyuan electronic PA8000 power analyzer basic power accuracy of 0.01%, bandwidth 5M, sampling rate 2MS / s, in the waveform acquisition and waveform reconstruction capabilities have a qualitative leap, I believe in waveform reconstruction On the other hand, it will get closer and closer to the oscilloscope and show more powerful capabilities.
KNBL1-32 Residual Current Circuit Breaker With Over Load Protection
KNBL1-32 TWO FUNCTION : MCB AND RCCB FUNCTIONS
leakage breaker is suitable for the leakage protection of the line of AC 50/60Hz, rated voltage single phase 240V, rated current up to 63A. When there is human electricity shock or if the leakage current of the line exceeds the prescribed value, it will automatically cut off the power within 0.1s to protect human safety and prevent the accident due to the current leakage.
leakage breaker can protect against overload and short-circuit. It can be used to protect the line from being overloaded and short-circuited as wellas infrequent changeover of the line in normal situation. It complies with standard of IEC/EN61009-1 and GB16917.1.
KNBL1-32 Residual Current Circuit Breaker,Residual Current Circuit Breaker with Over Load Protection 1p,Residual Current Circuit Breaker with Over Load Protection 2p
Wenzhou Korlen Electric Appliances Co., Ltd. , https://www.zjmotorstarter.com